
Upper Grand flows
- Learn how to read our River and stream flow charts, and our Reservoir charts.
- Many timeseries can be downloaded from our Data Downloads page.
Critical flows
| Gauge (Community) | Flow (m3/s) | Significance |
|---|---|---|
| Riverview | 0.1 | Normal summer low flow |
| Legatt (Grand Valley) | 0.5 | Normal summer low flow |
| 60 | Water at banks; low-lying areas flooded | |
| 135 | Water over CR25 | |
| 255 | Major flooding | |
| Marsville (Waldemar) | 0.8 | Normal summer low flow |
| 65 | Water at banks; low-lying areas flooded | |
| 290 | Major flooding | |
| Shand discharge (Elora) | 160 | Elora boardwalk floods |
| Salem, Irvine River | 0.3 | Normal summer low flow |
| West Montrose | 5 | Normal summer low flow |
| 125 | Campground floods | |
| Up to 180 | Warning Zone 1 | |
| 180 - 280 | Warning Zone 2; village floods | |
| 280 - 400 | Warning Zone 3 | |
| 670 | 1974 flood | |
| 400 - 700 | Warning Zone 4 | |
| 700 - 1400 | Warning Zone 5 |
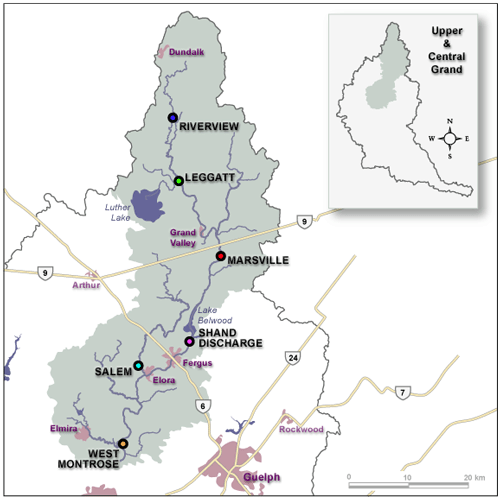
Location of flow gauges in the Upper Grand River
Provisional Data
Caution: Users of the GRCA's real-time data are cautioned to consider the provisional nature of the information before using it for decisions that concern personal or public safety or the conduct of business.
The Grand River Conservation Authority assumes no responsibility for the correctness of the information contained in this website nor liability to any user of such information, regardless of the purpose.
Warning! River levels and flows can change rapidly.
Contact Us
Grand River Conservation Authority
400 Clyde Road, PO Box 729
Cambridge, ON
N1R 5W6
Phone: 519-621-2761
Toll Free: 1-866-900-4722
grca@grandriver.ca